


Emerging Hit Finding Technology: High-throughput Spectral Shift (HT-SpS) for Binder and Molecular Glue Identification

Abstract
A novel affinity-based screening approach using the Spectral Shift (SpS) technology was developed at Eurofins Discovery for hit finding programs. In the context of kinase drug discovery, conventional approaches focus on activity-based assays targeting ATP sites. Using this direct biophysical measurement, it makes it possible to accelerate the discovery of kinase binders and initiate the design of rational and selective protein degraders.
The Dianthus uHTS (NanoTemper®) is a 1536-well instrument that relies on SpS technology, an immobilization-free detection method that uses precision optics to monitor changes in fluorescence intensity during biomolecular interactions under isothermal conditions. In addition to the 1536-well miniaturization, the equipment can read a plate in less than 8 min, making primary screening accessible with an exceptional throughput of more than 65,000 compounds per day. By screening 48,252 compounds in 1536 well-plates, we built a customized screening cascade able to identify PIM3 kinase binders.
We first developed an assay in 384-well plate format using the Dianthus. After protein quality assessment, the assay development was successfully validated for protein stability, signal-to-noise, time course and affinity values with the compound titration at different times of incubation. Using an Echo® acoustic droplet ejection in a 1536-well plate, the PIM3 miniaturized assay was successfully transferred to the uHTS Dianthus and validated for sensitivity and reproducibility. For the analysis, we developed an automated plate processing method which combines the uHTS Dianthus with Genedata Screener®.
Pilot studies with different conditions were performed in parallel. High-quality data sets were obtained with robust statistics data for the primary screen (SSMD > 6, low plate variability CV < 5%).
In addition to binder identification, HT-SpS can identify compound acting as molecular glue. To illustrate this, we took the WEE1 kinase and by adding several screening conditions, we were able to identify molecular glue binding respectively (or not) to the neo-substrate, CRBN E3 ligase and both partners simultaneously.
HT-SpS offers a significant breakthrough in early drug discovery. It provides a valuable alternative to AS-MS and DEL, making high-throughput, site-agnostic binding approaches achievable with a very small amount of the tested target, no data deconvolution, and with no need of compound multiplexing
Methods
Protein production by Eurofins DiscoverX. Cter His-tagged PIM3 was produced in insect cells from 10 L batches and purified by IMAC and gel filtration into 50 mM Hepes/NaOH pH 7.5, 150 mM NaCl, 5 % glycerol, 1 mM TCEP. CRBNmidi was produced in E.Coli and purified by IMAC and gel filtration into 50mM Hepes/NaOH, 500mM NaCl, 5% glycerol, 0.5mM TCEP, pH 8.0. Spectral Shift experiments. Kinases (PIM3 and WEE1) were respectively labeled using the His-Tag Labeling Kit RED-tris-NTA 2nd generation (ref: NT-L118, NanoTemper) and Large Volume Protein Labeling Kit RED-NHS 2nd Generation, NT-L111 (ref: NT-L111, NanoTemper) following supplier instructions in PBS-P+. Compounds were dispensed by Echo acoustic technology. For primary screen, 70 nL of compounds were tested in singlicate with 20 nM of labeled kinases (1% final DMSO). Hit confirmation was performed using DRC experiments in duplicates.
Spectral Shift Technology with uHTS Dianthus (NanoTemper)
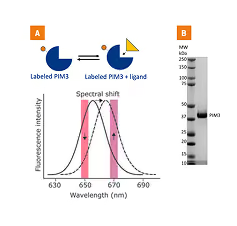
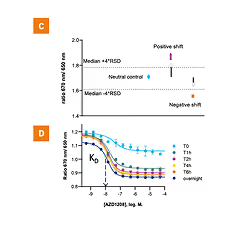
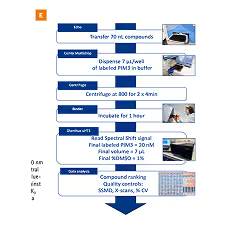
Figure 1. Spectral Shift principle. A. Schematic overview of the Spectral Shift assay with recombinant protein freshly labelled with a dye. Ligand binding may lead to a decrease of the red dyes emission at 650 nm and an increase of the 670 nm fluorescence or vice versa1.B. SDS-PAGE analysis of the purified PIM3. C. Single dose analysis for hit identification. Neutral control (DMSO) was used as reference and appropriate threshold was defined. Binders inducing red-shift (positive) and blueshift (negative) are depicted as purple triangles and orange circles, respectively. D. Plotting the 670 nm/650 nm ratio against the logarithmic concentration of a non-fluorescent ligand led to a sigmoidal binding curve that was used to extract the KD value of the interaction. Dose response curves of reference compound (AZD1208) at different incubation times allow for a time course analysis and the identification of the best assay window. E. High-Throu
Affinity-based Screening: PIM3 Primary Screen and Hit Confirmation
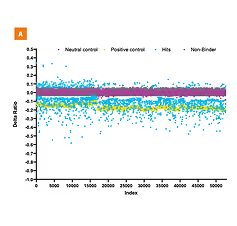
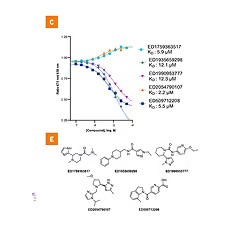
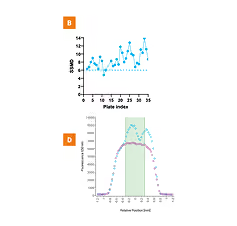
Figure 2. PIM3 primary screen, statistics and hit confirmation. A. 48,252 compounds from the diversity library were tested at 28 µM. 1866 binder hits were identified by HT-Spectral Shift. B. Quality of the assay was evaluated using SSMD values per plate. The overall value is > 6, indicating a high-quality data set. C. Dose-response curves of hit selected for the hit confirmation stage. Data were fitted using the tight binding fit equation from Genedata Screener. D. Examples of X-scan graphs used as quality controls for well homogeneity and aggregation. The blue curve depicts a compound inducing PIM3 aggregation (scan anomaly) whereas the purple curve is typical of a normal pattern. E. Chemical structures of selected PI
MedChem Analysis: Affinity-based vs. Activity-based Screening
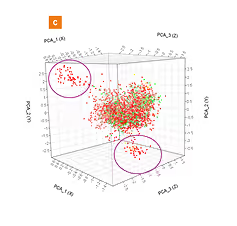
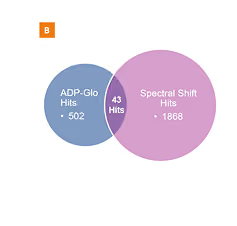
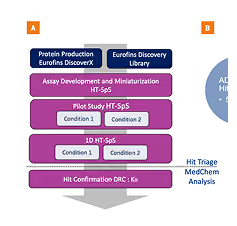
Figure 3. Screening cascade and Medchem comparative study. A. Affinity-based screening strategy using HT-SpS. Various conditions can be established in parallel to allow for the early qualification of the hits. B. Hits identified in the two assays (Spectral Shift and ADP-GloTM) were analyzed and showed a minimal overlap. C. Principal Component Analysis (PCA) performed on the Morgan Fingerprints (atom-based similarity, 1024 bits) revealed that the hits identified in the HT-SpS screen target additional chemical space not explored in the biochemical screen (represented by purple circles).
HT-Spectral Shift for Binder and Molecular Glue (MG) Identification

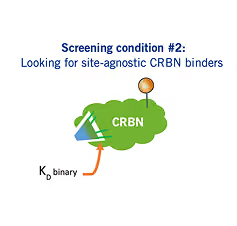
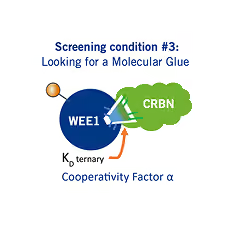
- Sensitive biophysical technique with direct binding measurement
- Simplified set-up with one labeled partner reducing the number of false positives (vs biochemical assays)
- Miniaturization in 1536-well plate format for throughput and reduced sample consumption
- Solution-based assay, proteins are not constrained by immobilization, allowing them to undergo structural changes upon binding (vs DEL or SPR)
- Discriminate affinity binding efficiency from each partner (cooperativity factor α)
HT-Spectral Shift for Binder and Molecular Glue (MG) Identification
WEE1 is a member of the serine/threonine kinase family and plays a crucial role in regulating cell cycle progression. Inhibiting WEE1 presents a promising strategy for cancer therapy. However, a major challenge is selectively targeting WEE1 in cancer cells.4 Targeted protein degradation provides an innovative therapeutic approach by leveraging small molecules to engage the ubiquitin-proteasome system, leading to the degradation of selective target proteins. This can be achieved using bifunctional PROTACs or molecular glues (MGs), both of which recruit the target protein to an E3 ligase. We focused on identifying PROTACs and MGs that bind to WEE1, with Cereblon (CRBN) acting as the E3 ligase. For screening, we produced a truncated CRBN construct (CRBNmidi) with similar function to the full-length wild-type CRBN.5 A focused-library of 106 molecular glues and PROTAC compounds were tested against WEE1 and CRBNmidi.
Primary Screening for Identification of Binary and Ternary Binders
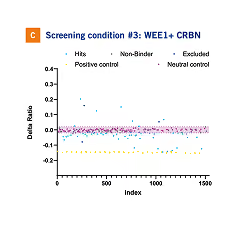
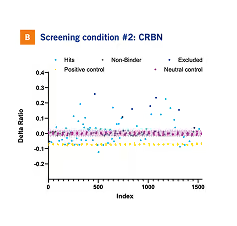
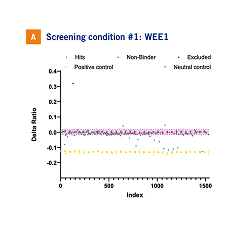
Figure 4: Primary screen for binder identification using HT-SpS. A library of 106 compounds was tested at 10 µM final concentration in parallel using 3 different conditions. A. Direct binding of the compounds to labeled WEE1. Adavosertib was used as positive control for WEE1 at 30 µM and depicted as yellow circles. Horizontal purple dashed lines represent ± 4 RSD of DMSO controls depicted as purple circles. B. Direct binding of the compounds to labeled CRBNmidi. Lenalidomide was used as positive control at 30 µM and depicted as yellow circles. Horizontal purple dashed lines represent ± 3 RSD of DMSO controls depicted as purple circles. C. Direct binding of the compounds to labeled WEE1 co-incubated with CRBNmidi to identify ternary complex formation. Adavosertib was used as positive control at 30 µM and depicted as yellow circles. Horizontal purple dashed lines represent ± 4 RSD of DMSO controls depicted as purple circles.
Primary Screening for Identification of Binary and Ternary Binders
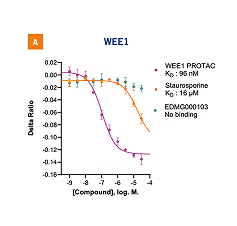
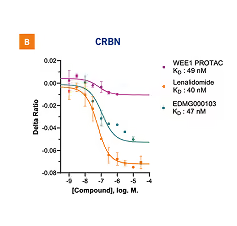
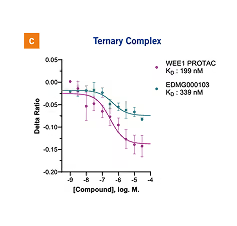
Figure 5: Parallel hit confirmation by HT-SpS. A. Example of binding curves obtained with known WEE1 binders (Staurosporine and WEE1 PROTAC: Pomalidomide-C3-adavosertib). The WEE1 glue EDMG001037 does not bind WEE1 in absence of E3 ligase. B. Example of binding curves obtained with known CRBN binders (Lenalidomide and WEE1 PROTAC: Pomalidomide-C3-adavosertib). C. Example of binding curves obtained with known WEE1 binders (WEE1 PROTAC: Pomalidomide-C3-adavosertib). The WEE1 glue EDMG00103 binds to WEE1 in presence of CRBN E3 ligase.
Venn Diagram and Ternary Complex – MG Hit Validation
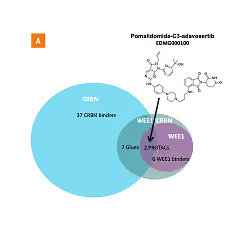
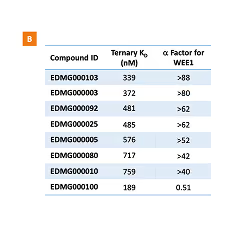
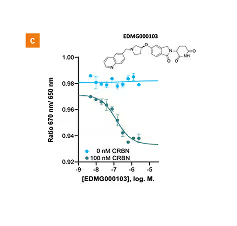
Figure 6. PROTAC and MG hit validation. A. Venn diagram summarizing the hit list in each screen condition (CRBN binders, WEE1 binders and WEE1/CRBN binders) and highlighting the shared hit list. Pomalidomide-C3-adavosertib EDMG0001006 showed binding to both CRBN and WEE1 and induced the ternary complex formation. B. Ternary binding affinities against WEE1/CRBN complex. Cooperativity (α) values were calculated based on binary and ternary KD with WEE1 C. Example of hit confirmation for the molecular glue hit EDMG000103. The experiment was performed in Dianthus equipment using 384w plate forma
References
- Langer, A. et al. A New Spectral Shift-Based Method to Characterize Molecular Interactions. Assay Drug Dev. Technol. 2022, 20, 83-94.
- Johnson, T.W. et al.. Using the Golden Triangle to optimize clearance and oral absorption.Bioorg. & Med. Chem. Lett. 2009,19, 5560-5564.
- Wold, S. et al.. Principal component analysis. Chemom. Intell. Lab. Syst. 1987, 37-52.
- Razumkov, H. et al.. Discovery of CRBN-Dependent WEE1 Molecular Glue Degraders from a Multicomponent Combinatorial Library J. Am. Chem. Soc.2024, 146, 31433–31443.
- Kroupova, A., Spiteri, V.A., Rutter, Z.J. et al. Design of a Cereblon construct for crystallographic and biophysical studies of protein degraders. Nat. Commun. 2024, 15, 8885. 6. Example 13 from Gray, N.S. et al.. Degraders of WEE1 Kinase. WO2020069105, 2020. 7. Example S36 from Sapienza, J. et al.. WO2024006881, 2024.
